9:17 AM, 7th October 2021, About 3 years ago
Text Size
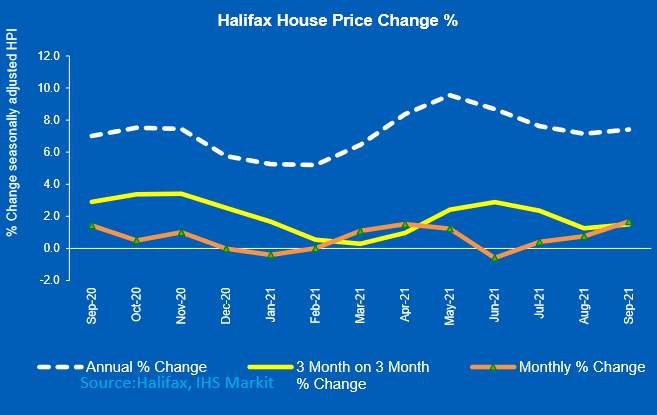
The latest Halifax House price index has indicated annual house price inflation has increased from last month to 7.4%, up from 7.2% with the average UK property price now at a record £267,587. Wales and Scotland have continued to outperform the UK average
Russell Galley, Managing Director, Halifax, said: “UK house prices rose by 1.7% in September, adding more than £4,400 to the value of the average property. This rate of monthly growth was the strongest since February 2007, pushing year-on-year house price inflation up to 7.4%. This also reversed the recent three-month downward trend in annual growth, which had peaked at an annual rate of 9.6% in May. The price of an average house is now as expensive as it has ever been, standing at just over £267,500.
“While the end of the stamp duty holiday in England, and a desire amongst homebuyers to close deals at speed, may have played some part in these figures, it’s important to remember that most mortgages agreed in September would not have completed before the tax break expired. This shows that multiple factors have played a significant role in house price developments during the pandemic.
“The ‘race-for-space’ as people changed their preferences and lifestyle choices undoubtedly had a major impact. Looking at price changes over the past year, prices for flats are up just 6.1%, compared to 8.9% for semi-detached properties and 8.8% for detached. This translates into cash increases for detached properties of nearly £41,000 compared to just £6,640 for flats.
“Against a backdrop of rising pressures on the cost of living and impending increases in taxes, demand might be expected to soften in the months ahead, with some industry measures already indicating lower levels of buyer activity. Nevertheless, low borrowing costs and improving labour market prospects for those already in employment are likely to continue to provide support.
“Perhaps the biggest factor in determining the future of house prices remains the limited supply of available properties. With estate agents reporting a further reduction in the number of houses for sale, this is likely to underpin average prices – though not the recent rate of price growth – into next year.”
Stamp Duty snapshot
In June 2020, the month before the stamp duty (SDLT) holiday began, the typical standardised price for a UK property was £239,317. Therefore a home-mover would have faced SDLT costs of around £2,300.
From July last year, the zero rate introduced on homes valued up to £500,000 (falling to £250,000 between July and September this year as the holiday was tapered out) meant no stamp duty would be payable on that same property.
By September 2021, average house prices were some £28,270 higher, more than 12 times greater than that initial saving. Today, with the tax break over, home-movers face a bill of nearly £3,400 for the same property, as with an average price of £267,587, they’ve also now been pushed into a higher SDLT bracket (tax rate of 5% applies between £250,000 to £925,000).
Regions and nations house prices
Wales continues to record the strongest house price inflation of any UK region or nation, with annual growth of 11.5% in September (average house price of £194,286). Scotland also continues to outperform the UK national average, with growth of 8.3% (average house price of £188,525). Note that in both nations, the equivalent stamp duty holidays came to an end at an earlier date.
The South West remains the strongest performing region in England, with annual house price growth of 9.7% (average house price of £276,226). The weakest performing regions in terms of annual house price inflation are all to be found in the South and East of England, though it should be highlighted that these are also the areas with the highest average house prices. Eastern England has seen annual growth of 7.2% (average house price of £310,664) while in the South East it’s 7% (average house price of £360,795).
Greater London remains the outlier, with annual growth of just 1% (average house price of £510,515), and was again the only region or nation to record a fall in house prices over the latest rolling three-monthly period (-0.1%).
Housing activity
• HMRC monthly property transactions data for UK home sales increased in August 2021. UK seasonally adjusted residential transactions in August 2021 were 98,300 – up by 32% from July’s figure of 74,470 (up 28% on a non-seasonally adjusted basis). The latest quarterly transactions (June-August 2021) were approximately 11% lower than the preceding three months (March 2021-May 2021). Year on year, transactions were 21% higher than August 2020 (25% higher on a non-seasonally adjusted basis). (Source: HMRC, seasonally-adjusted figures)
• The latest Bank of England figures show the number of mortgages approved to finance house purchases fell in August 2021 by 1% to 74,453. Year-on-year, the August figure was 15% below August 2020. (Source: Bank of England, seasonally-adjusted figures)
• The latest results from RICS Residential Market Survey point to a further softening of activity in August 2021. New buyer enquiries fell for a second consecutive month, with the net balance dipping a little deeper into negative territory at -14% (-9% in July). Newly agreed sales declined for a third consecutive month, with a net balance of -18% (-22% previously) and new instructions remain in negative territory at -37% (45% previously). (Source: Royal Institution of Chartered Surveyors’ (RICS) monthly report)
Previous Article
Section 21 Eviction Rules From October 1st