


Legacy Means More Than Wealth Alone
8 months ago

More landlords than ever are stopping to take stock. The days of constant expansion are giving way to careful evaluation, because the cost of standing still has started to feel as risky as the cost of growth.
Legislation, regulation, and taxation now shape almost every decision. A single oversight can turn a profitable portfolio into a liability, and no landlord wants to watch years of effort slip through the cracks. The instinct for growth remains strong, we can’t help ourselves when we walk past an estate agent’s window, but the priority has shifted towards security and control.
Property still provides one of the most dependable foundations for long-term wealth, yet the real measure of success has become how safely that wealth is structured, protected, and passed on.
Today’s landlords see themselves as business owners, not speculators. They take pride in managing assets responsibly, providing good homes, and keeping ahead of regulation. That professionalism is being tested as compliance demands and risks multiply, and margins narrow.
Some are choosing to streamline. They are selling weaker performers first, reducing debt, and keeping the properties that deliver the best returns for effort and risk. Others are reorganising ownership to strengthen cash flow or prepare for succession. Behind every decision is the same motivation: to protect their position and preserve their legacy.
Hope now comes from clarity rather than optimism. Landlords want a plan that gives them freedom to choose their next step with confidence.
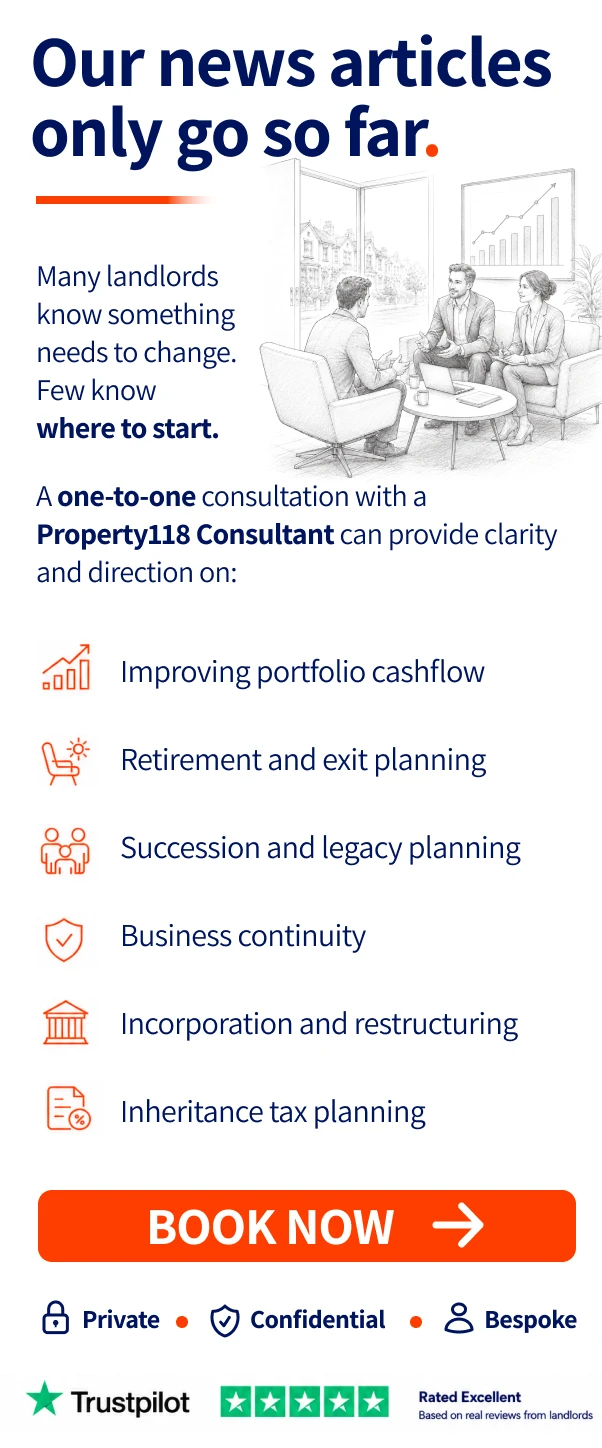
A rental property business no longer rewards guesswork. Accountants focus on tax, brokers on finance, lawyers on structure, yet no one joins those threads together. That is where confusion turns into frustration.
Property118 bridges those gaps. A consultation with Property118 gives landlords a single point of reference, transforming scattered information into a clear understanding of what truly matters. It begins with a discussion about objectives, family, and finance. We identify where exposure lies and where opportunities remain.
Curiosity drives the process. Many clients arrive wanting to test an idea or sense-check a plan. They leave with renewed trust in their own decisions and confidence that each move fits within the rules.
The feeling most often experienced by landlords who consult us is relief.
Relief that we understand them, the numbers finally make sense, that risks are contained, and that there is still a future for them in a business that’s still worth being proud of. For some landlords, the conversation rekindles ambition; for others, it brings peace of mind that retirement and passing on a legacy with minimal hassle can be approached on their terms.
It is also about belonging. Thousands of landlords use Property118 not because we promise shortcuts but because they value being part of a community that approaches property investment professionally, ethically, and intelligently.
Every consultation ends with a renewed sense of freedom. Decisions feel lighter, the next steps clearer, and the purpose of ownership sharper.
Our consultancy doesn’t only cover retirement, business continuity and legacy planning. It can also unlock the lifestyle you once dreamed about but forgot to implement.
Where our recommendations touch on areas requiring regulated input, we refer clients to appropriately authorised professionals for advice and execution.
|
★★★★★
|
Help other landlords find Property118If you have found Property118 useful, a short Trustpilot review would make a meaningful difference. It helps other landlords decide whether our research is worth following. |
8 months ago

10 months ago

9 months ago | 4 comments