10:41 AM, 29th July 2021, About 3 years ago
Text Size
The Nationwide House price index for July indicates some heat is being taken out of the housing market, but overall annual inflation is still high.
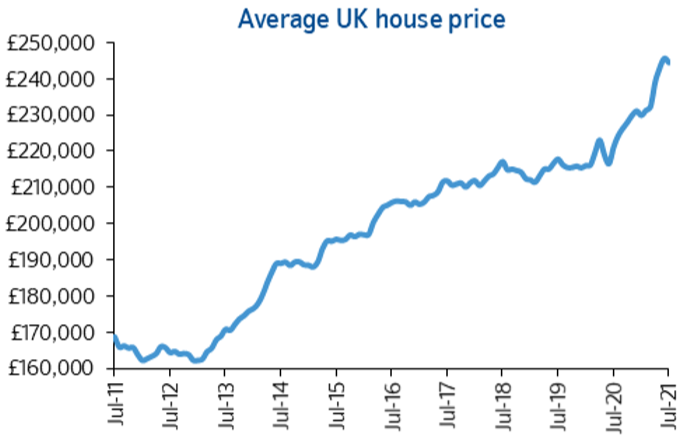
Annual house price growth remained in double digits, but fell back to 10.5% with prices down 0.5% month-on-month. The average price for a house in June was £245,432, but for July it now stands at £244,229.
Robert Gardner, Nationwide’s Chief Economist, said: “Annual house price growth slowed to 10.5% in July, from the 17-year high of 13.4% recorded the previous month. In month-on-month terms, house prices fell by 0.5%, after taking account of seasonal effects, following a 0.7% rise in June.
“The modest fallback in July was unsurprising given the significant gains recorded in recent months. Indeed, house prices increased by an average of 1.6% a month over the April to June period, more than six times the average monthly gain recorded in the five years before the pandemic.
“The tapering of stamp duty relief in England is also likely to have taken some of the heat out of the market. The nil rate band threshold decreased from £500,000 to £250,000 at the end of June (it will revert to £125,000 at the end of September. This provided a strong incentive to complete house purchases before the end of June, especially for higher priced properties. For those purchasing a property above £250,000, the maximum stamp duty saving reduced from £15,000 to £2,500 after the end of June.
Stamp duty impacting the timing of transactions
“The stamp duty changes drove the number of housing market transactions to a record high of almost 200,000 in June as home buyers rushed to beat the deadline. This was around twice the number of transactions recorded in a typical month before the pandemic and 8% above the previous peak seen in March.
The pattern of transactions has also shifted
“Land Registry data indicates that higher priced properties have been driving the increase in housing market activity since the pandemic struck.
“For example, the number of transactions involving properties bought for £500,000 or higher increased by 37% over the 12 months to March 2021, compared to a rise of 2% for all properties. As a result, between Q1 2020 and Q1 2021 the share of transactions involving a property valued at £500,000 or above has increased from 12% to 18%.
“There has also been a shift in the composition of property types that have been transacting. Over the past six months the proportion of sales involving detached and semi-detached properties has increased, while the proportion involving flats has declined significantly.
Stamp duty not the only factor at play
“While tax changes have been important in determining the timing of transactions and the trends noted above, they have not been the main factor prompting people to move in the first place. Amongst homeowners surveyed at the end of April that were either moving home or considering a move, three quarters said this would have been the case even if the stamp duty holiday had not been extended beyond the original March 2021 deadline.
“Shifting housing preferences appear to have been the more important factor in driving the increase in housing market activity, with people reassessing their housing needs in the wake of the pandemic. At the end of April, 25% of homeowners surveyed said they were either in the process of moving or considering a move as a result of the pandemic. Given that only c5% of the housing stock typically changes hands in a given year, it only requires a relatively small proportion of people to follow through on this to have a material impact.
Outlook – still clouded
“Interestingly, the ‘savings’ from the stamp duty holiday have been dwarfed by the impact of recent house price gains. For example, the price of the typical UK property increased by around £24,500 between July 2020 the end of June this year, whereas the stamp duty saving on that property for a home mover (in England) was c£1,900. For a £500,000 property that saw the same average increase as the typical property over the same period, the comparable house price increase was c£57,000 against a stamp duty saving of £15,000.
“Underlying demand is likely to remain solid in the near term. Consumer confidence has rebounded in recent months while borrowing costs remain low. This, combined with a lack of supply on the market, suggests continued support for house prices. But, as we look toward the end of the year, the outlook is harder to foresee.
“Activity will almost inevitably soften for a period after the stamp duty holiday expires at the end of September, given the incentive for people to bring forward their purchases to avoid the additional tax.
“Nevertheless, underlying demand is likely to soften around the turn of the year if unemployment rises, as most analysts expect, as government support schemes wind down. But even this is far from assured. Even if the labour market does weaken, there is also scope for shifts in housing preferences as a result of the pandemic to continue to support activity for some time yet.”
Previous Article
Section 20 notice required even if we have the money?