Profile incomplete
15:53 PM, 31st March 2021, About 3 years ago
Text Size
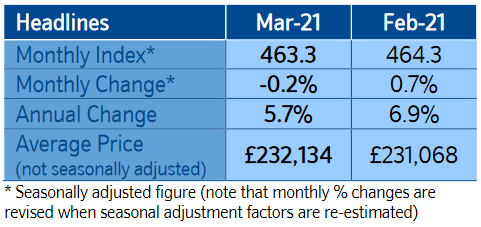
The latest Nationwide House Price Index for March with prices down 0.2% month–on–month, after taking account of seasonal factors.
Commenting on the figures, Robert Gardner, Nationwide’s Chief Economist, said: “Annual house price growth slowed to 5.7% in March, from 6.9% in February.
“Given that the wider economy and the labour market has performed better than expected in recent months, the slowdown in March probably reflects a softening of demand ahead of the original end of the stamp duty holiday before the Chancellor announced the extension in the budget.
“Recent signs of economic resilience and the stimulus measures announced in the Budget, including the extension of the furlough scheme and the stamp duty holiday, as well as the introduction of a mortgage guarantee scheme, suggest that housing market activity is likely to remain buoyant over the next six months.
“The longer–term outlook remains highly uncertain. It may be that the recovery continues to gather momentum and that shifts in housing demand resulting from the pandemic continue to lift the market. However, if the labour market weakens towards the end of the year as policy support is withdrawn, as most analysts expect, then activity is likely to slow nearer the end of 2021, perhaps sharply.”
Mixed picture across regions in Q1
“Overall UK annual house price growth in Q1 was similar to Q4, although there was a mixed picture across the regions, with around half seeing a slowdown in growth.
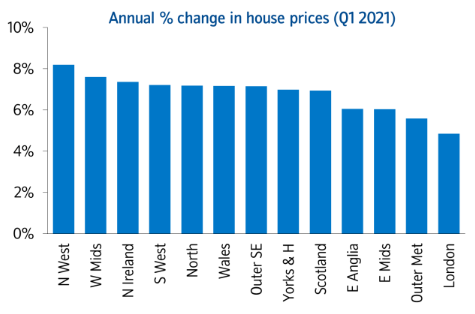
“Northern Ireland saw the highest growth of the home nations, with a 7.4% increase. Meanwhile, Wales and Scotland both saw an acceleration in annual price growth to 7.2% and 6.9% respectively.
“England was the weakest performing home nation in the three months to March 2021, with annual house price growth of 6.4% a slight slowing compared with last quarter(Q4 2020), when prices rose at an annual rate of 6.9%.
“The North West was the strongest performing region, with prices up 8.2% year–on–year. This is the strongest price growth seen in the region since 2005 and average prices reached a record high of £181,999. There was also a further pickup in price growth in the neighbouring North, which saw a 7.2% annual increase.
“London was the weakest performing region, with annual price growth softening to 4.8%, from 6.2% in Q4 last year.
“The surrounding outer Metropolitan region, which includes places such as Slough, Guildford, Crawley and Chelmsford, saw annual price growth remain stable at 5.6%.
“The South West was the only southern region to see an acceleration in annual price growth, which picked up to7.2%in Q1, from 6.6% in Q4.
“Annual house price growth remained broadly stable in West Midlands at 7.6%, but the East Midlands, the top-performing region last quarter, saw slower annual growth of 6.0%.”


Previous Article
What can tenants do about noisy neighbours?Next Article
Are flats or houses best for Buy To Let investors?